
The Today screen
Reading the home screen: values, colors and where each came from.
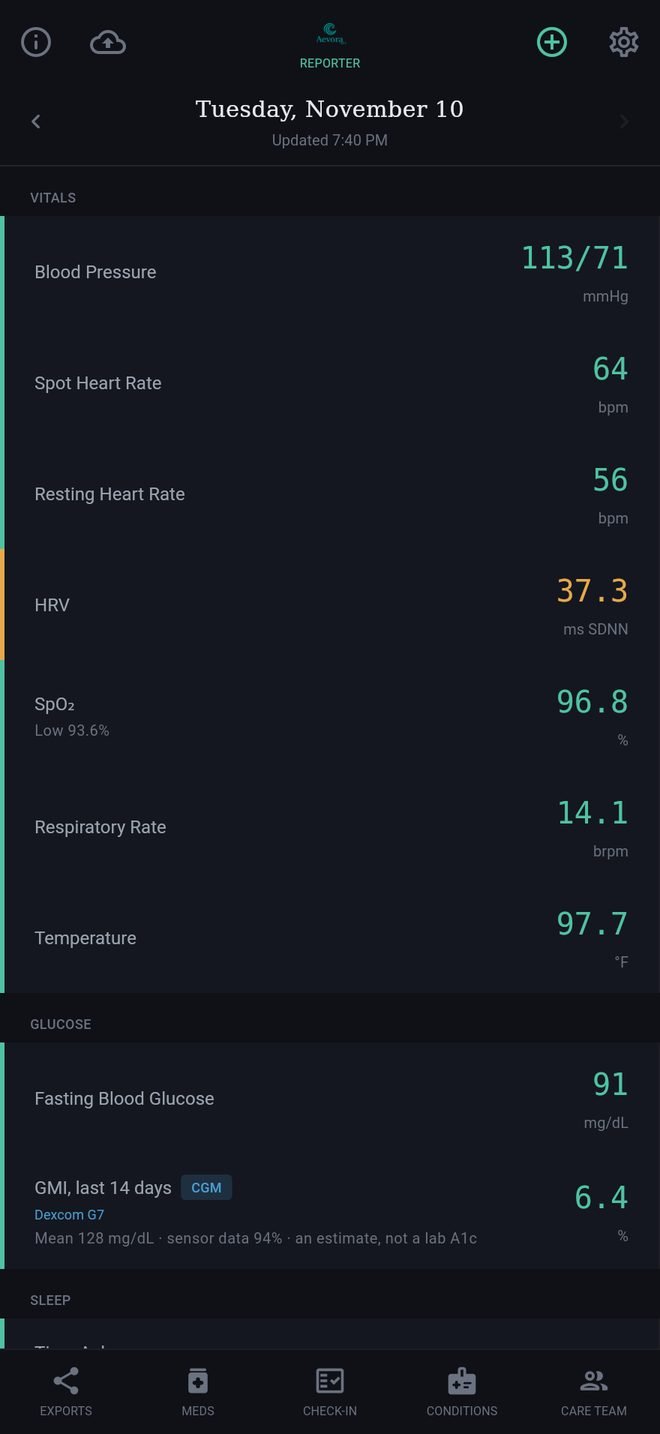
Today is the home screen: one line for each kind of reading, grouped as Vitals, Glucose, Sleep and Activity.
Reading a line
- The number on the right is the day's value. A dash means nothing was found for that day.
- Blood pressure is the day's latest reading. Spot Heart Rate is the pulse taken with that blood pressure reading, so it is blank on a day with no blood pressure.
- Oxygen saturation shows the day's average, with the lowest value under the name.
- The colored bar at the left edge is green, amber or red, from fixed general ranges. It is a visual cue only. It does not know your own targets and is not advice; your care team's numbers are what matter. See Call notices and call-us numbers.
- A small tag beside a name, such as CGM, says how a value was worked out.
Moving around
- Pull down to fetch the latest readings.
- Tap the arrow at the left of the date to see earlier days; the arrow at the right comes back.
- Tap any line for its 30-day chart. See Trends.
- Tap + to type in a reading. See Log Vitals.
Fasting glucose
With a continuous glucose monitor, the fasting value is worked out from the readings around the time you woke, using several methods together, which is steadier than a single reading. With only a meter, it is the reading nearest waking, or failing that the day's latest.
If a monitor writes to Apple Health, a second line shows your 14-day GMI. See GMI.
Glucose is shown in mg/dL or mmol/L. Choose which in Settings under Profile; the choice applies to Today, the charts, Log Vitals, every report and the Care Packet.
The Today screen
Reading the home screen: values, colors and where each came from.
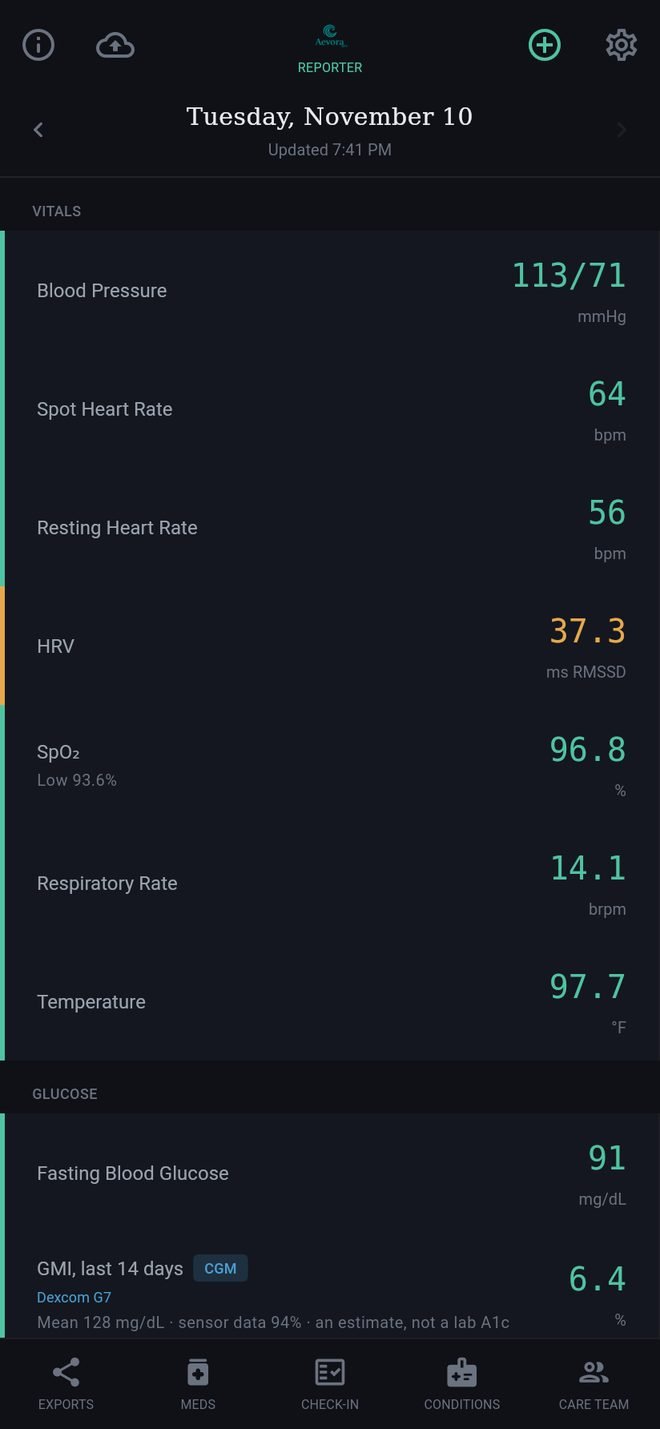
Today is the home screen: one line for each kind of reading, grouped as Vitals, Glucose, Sleep and Activity.
Reading a line
- The number on the right is the day's value. A dash means nothing was found for that day.
- Blood pressure is the day's latest reading. Spot Heart Rate is the pulse taken with that blood pressure reading, so it is blank on a day with no blood pressure.
- Oxygen saturation shows the day's average, with the lowest value under the name.
- The colored bar at the left edge is green, amber or red, from fixed general ranges. It is a visual cue only. It does not know your own targets and is not advice; your care team's numbers are what matter. See Call notices and call-us numbers.
- A small tag beside a name, such as CGM, says how a value was worked out.
Moving around
- Pull down to fetch the latest readings.
- Tap the arrow at the left of the date to see earlier days; the arrow at the right comes back.
- Tap any line for its 30-day chart. See Trends.
- Tap + to type in a reading. See Log Vitals.
Fasting glucose
With a continuous glucose monitor, the fasting value is worked out from the readings around the time you woke, using several methods together, which is steadier than a single reading. With only a meter, it is the reading nearest waking, or failing that the day's latest.
If a monitor writes to Health Connect, a second line shows your 14-day GMI. See GMI.
Glucose is shown in mg/dL or mmol/L. Choose which in Settings under Profile; the choice applies to Today, the charts, Log Vitals, every report and the Care Packet.