
Show instructions for
Trends
The 30-day chart behind every line on Today.
Tap any line on Today to see that reading over the last 30 days.
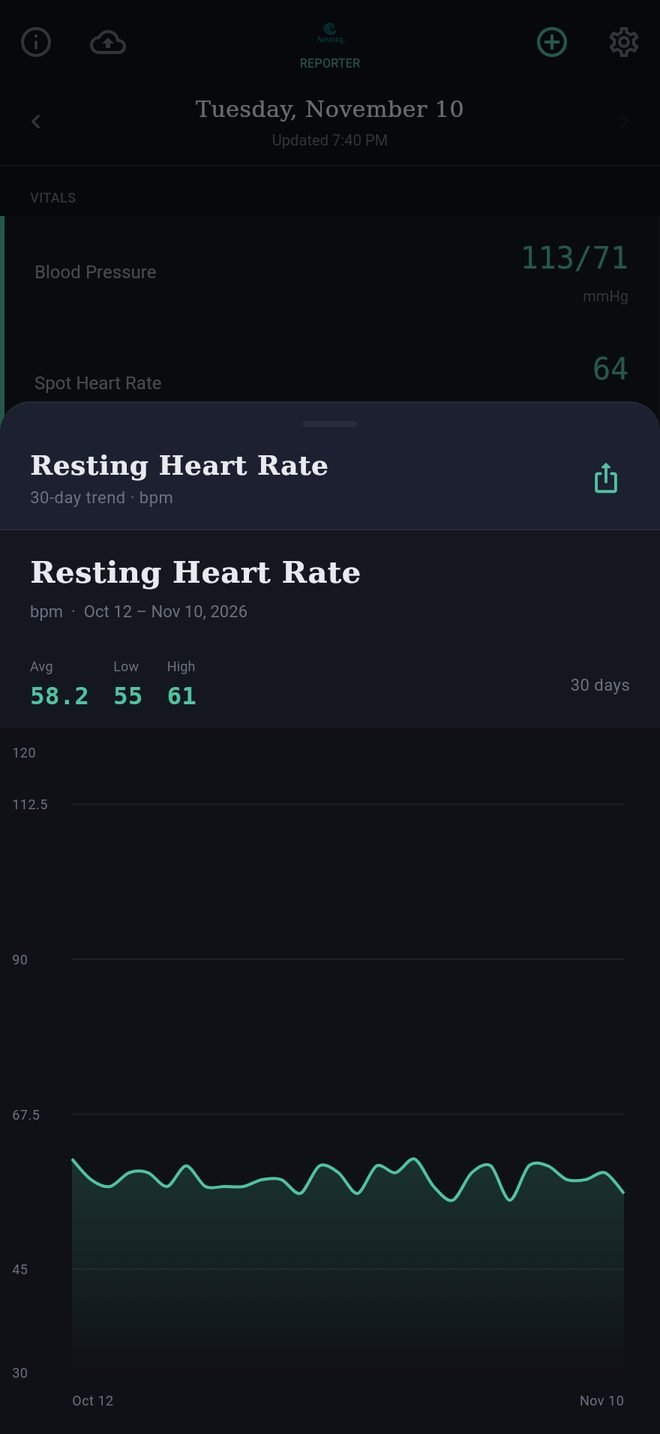
- Each point is one day's value. Blood pressure shows the top and bottom numbers as two lines.
- Days with no reading are simply gaps.
- Temperature, weight and glucose are drawn in the units you chose in Settings under Profile.
- Share as image sends the chart, labeled with what it is and the dates, through your phone's share sheet.
If the chart says there is no data in the last 30 days, go back to Today and pull down to refresh. If it is still empty, see No readings showing.
Trends
The 30-day chart behind every line on Today.
Tap any line on Today to see that reading over the last 30 days.
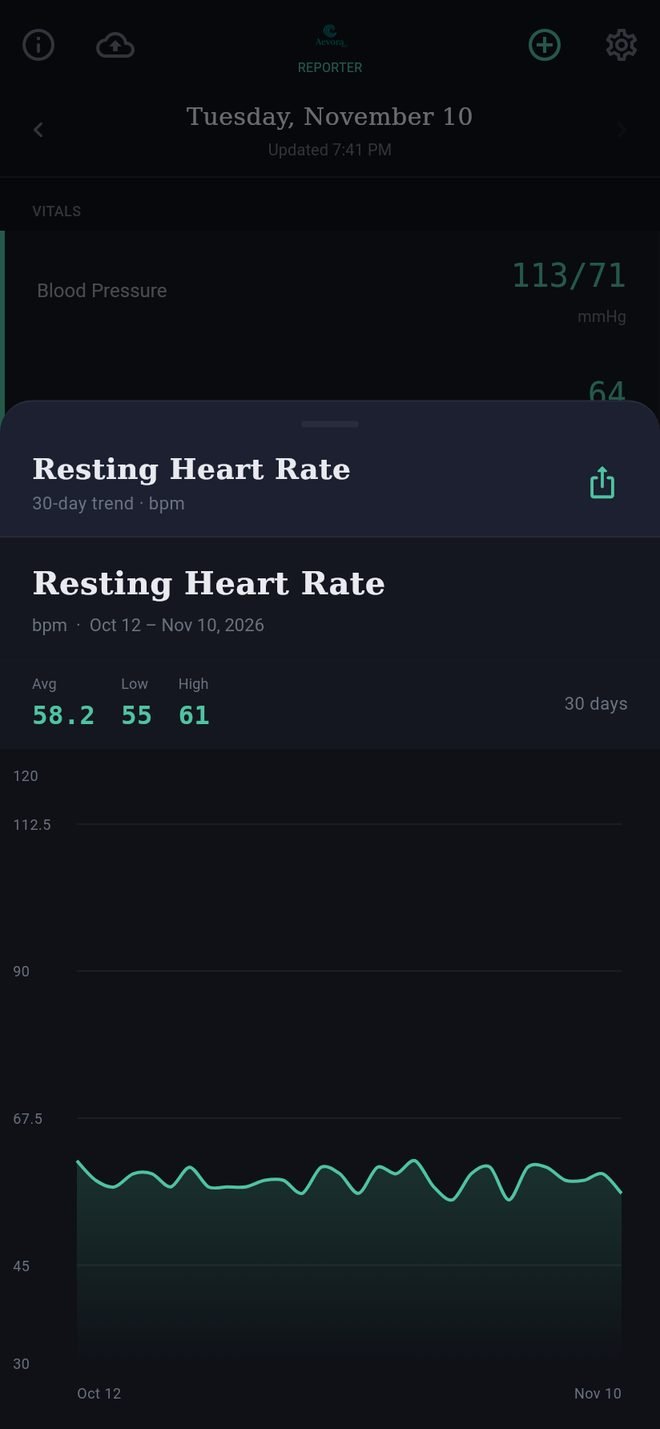
- Each point is one day's value. Blood pressure shows the top and bottom numbers as two lines.
- Days with no reading are simply gaps.
- Temperature, weight and glucose are drawn in the units you chose in Settings under Profile.
- Share as image sends the chart, labeled with what it is and the dates, through your phone's share sheet.
If the chart says there is no data in the last 30 days, go back to Today and pull down to refresh. If it is still empty, see No readings showing.